Coronavirus: See How Many Medical Ventilators There Are in Your Town
R Markdown
For patients critically ill with COVID-19, access to a ventilator could be a matter of life or death. In early March at the beginning of the COVID-19 pandemic the Serbian government was not disclosing information about the available number of ventilators to its citizens. CINS’ journalists took the initiative to obtain this information and to make it available to the public in an article concerning respiratory equipment in the current crisis. Shortly after, the government took more serious action towards protecting its citizens against the virus.
As a data scientist I was pleased to assist CINS’ journalists in making interactive maps informing readers of their findings.
This article can be found at https://www.cins.rs/en/coronavirus-see-how-many-medical-ventilators-there-are-in-your-town/
To create an interactive map like this in R you will need the leaflet package. Leaflet is one of the most popular open-source JavaScript libraries for interactive maps that was integrated into R, by a team of people from RStudio. We will illustrate how easy it is to plot a location map using the leaflet package, but you can learn more about this package from the Leaflet for R website.
Here is what we did.
library(leaflet)
suppressPackageStartupMessages(library(dplyr))
suppressPackageStartupMessages(library(tidyverse))

mydata <- read.csv('Gradovi.csv',
                    header=T,
                    na.strings=c("","NA"),
                    stringsAsFactor = FALSE)

glimpse(mydata)
## Rows: 69
## Columns: 7
## $ Mesta <chr> "Bačka Topola", "Subotica", "Kikinda", "Senta", "Zrenja…
## $ Latitude <dbl> 45.81442, 46.10055, 45.82728, 45.92601, 45.38156, 45.77…
## $ Longitude <dbl> 19.63796, 19.66506, 20.46152, 20.07809, 20.36857, 19.11…
## $ Koristi.se <int> 1, 19, 6, 6, 13, 14, 3, 1, 4, 14, 98, 48, 1, 1, 0, 16, …
## $ Ne.koristi.se <int> 0, 0, 0, 1, 0, 0, 0, 0, 2, 0, 5, 8, 0, 0, 1, 0, 0, 0, 0…
## $ Nepoznato <int> 0, 0, 0, 0, 0, 0, 0, 0, 0, 0, 6, 0, 0, 0, 0, 0, 0, 0, 0…
## $ Ukupno <int> 1, 19, 6, 7, 13, 14, 3, 1, 6, 14, 103, 56, 1, 1, 1, 16,…minlat <- min(mydata$Latitude)
maxlat <- max(mydata$Latitude)
minlng <- min(mydata$Longitude)
maxlng <- max(mydata$Longitude)
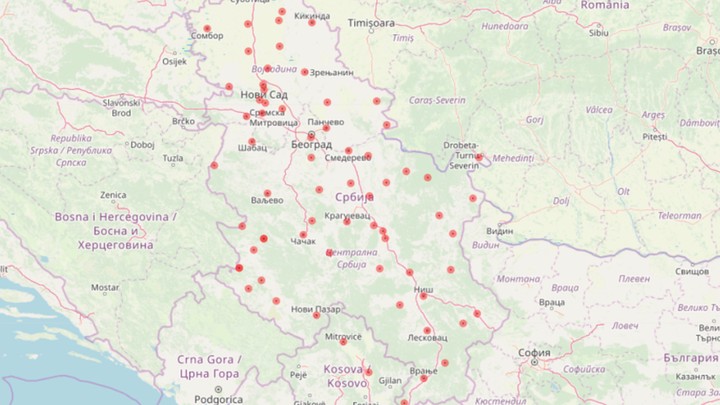
mydata %>%
leaflet() %>%
addTiles() %>%
fitBounds(~minlng, ~minlat, ~maxlng, ~maxlat) %>%
addCircles(lng = ~Longitude, lat = ~Latitude,
radius = 750, weight = 7, color = "black",
fillColor = "red", fillOpacity = 0.7,
popup = ~paste("<b>", Mesta, "</b>", "<br>Koristi se = ", Koristi.se,"<br>Ne koristi se = ", Ne.koristi.se, "<br> Nepoznato =", Nepoznato, "<br>Total =", Ukupno, "<br>"))This was data democracy in action, a means of holding governments to account and nudging them into action. By empowering citizens to be data literate they are able to cut through the fog of misinformation and to have a deeper understanding of the world we live in. There is no need for everyone to be a data scientist, but there is an urgent need for data literacy to be available to everyone. Data is democracy.
Tatjana Kecojevic
statistician and ever evolving data scientist
My research work has developed my knowledge and skills within the area of applied statistical modelling. As such, the area of my research enhances the opportunities for cross discipline projects.